Skip to content
CASE STUDY Product Designer & Builder · Omnis AI

I was spending a day finding UX problems. So I built the audit engine.

At Omnis AI, I was the solo product designer across five legal-tech products. Manual staging reviews took hours and missed hidden states. I built an engine that logs in, explores interactive states, and generates developer-ready reports at ~$0.30 a screen.

Muzeeb Urrahaman Solo designer + builder Jun – Jul 2026 Omnis AI
229
Deterministic checks
342
Total audit rules
31
AI analysis lenses
187
Passing tests
~27k
Lines of TypeScript
90%+
Findings tied to real elements
01
Context

Given a product URL and staging credentials, the engine logs in, explores interactive states, and outputs a self-contained report with code-level findings.

As the solo product designer across five legal-tech products at Omnis AI, I had to audit live staging apps screen by screen. Doing that manually for every release was unsustainable, so I built an automated audit engine to handle the repetitive passes.

A typical manual audit required capturing screenshots, redlining issues in Figma, cataloging tokens, and filing engineering tickets. Because fixes required complete re-verification, design QA quickly became a release bottleneck.

Problem

  • Manual QA across 5 products took hours and produced inconsistent tickets.
  • Interactive states (modals, validation errors, empty views) were routinely missed.
  • Verifying engineer fixes required repeating the entire manual review cycle.

Solution

  • Automated crawler logs in and walks every screen and interactive view.
  • Applies deterministic WCAG rules and design heuristics grounded in the live DOM.
  • Exports annotated reports with exact CSS selectors and remediation code.

Results

  • Audits complete in ~3 minutes at ~$0.30 per screen.
  • Systematic state exploration provides verified coverage across all controls.
  • Engineers receive copy-paste CSS patches with before/after visual diffs.
02
The insight

Quality regressions lived inside interactive states.

A default dashboard layout often looked clean on initial render. Regressions appeared once a user opened a dropdown, triggered form validation errors, expanded drawer menus, or encountered empty data views.

Manual reviewers rarely had time to click through every interactive permutation on staging. Consequently, state-specific bugs consistently reached production.

Solving this required moving beyond static screenshot inspection to build a crawler capable of interacting with the live application.

03
The challenge

Key technical hurdles for automated design QA.

01

Interactive State Exploration

Crawling not only initial page loads, but opening every dialog, dropdown, and tab dynamically.

02

DOM-Grounded Verification

Rejecting visual hallucinations by requiring every issue to anchor to an existing DOM selector.

03

Actionable Engineering Handoff

Providing exact line numbers, computed CSS values, and diff-ready token patches.

04

Deterministic Accuracy

Running code-level axe accessibility math first, reserving LLM vision strictly for semantic layout judgment.

04
Before → After

Replacing manual design redlining with automated audit passes.

Comparing the manual review loop against the automated inspection pipeline.

Before · Manual QA (1+ day per product)
  • Open each staging screen manually in a browser.
  • Take screenshots, paste into Figma, draw redlines and annotate notes.
  • Attempt to test modals, dropdowns, and error states manually.
  • Export image files and answer developer questions on specific selectors.
  • Repeat the entire review from scratch after engineers push fixes.
After · Automated Engine (~3 min per screen)
  • Run the CLI: audit <url> <credentials>
  • Crawler logs in, walks every screen, and triggers all interactive controls.
  • Maps findings to DOM elements, calculates contrast, and builds reports.
  • Developers receive exact CSS selectors with copy-paste token patches.
  • Re-auditing after a PR requires a single command with delta tracking.
DimensionBefore · ManualAfter · The Engine
Time per screen~2–3 hours of designer time~3 minutes
Cost per screen~$400 (designer time estimate)~$0.30 (compute + API)
Interactive statesInconsistently checkedEvery state explored
ConsistencyVaries by reviewer bandwidthDeterministic rule evaluation
Coverage recordNoneExact DOM inventory record
Dev handoffStatic Figma screenshotCSS selector + diff-ready patch
Re-audit verificationComplete manual redoAutomated delta comparison
Workflow comparison diagram: manual review cycle in red versus the automated engine pass in green
Workflow comparison: manual review cycle (top, red) versus the automated engine pass (bottom, green).
05
The turning point

Why static screenshot analysis failed.

The initial prototype analyzed static screenshots. It produced quick lists of findings, but real-world testing revealed a critical problem.

When run against a dashboard screen I knew thoroughly, the vision model reported: "Low contrast on the secondary button beside the search field." It generated coordinates, severity, and a suggested CSS token.

That secondary button did not exist in the DOM. The vision model had hallucinated an element based on typical dashboard layout patterns. A tool that invents issues requires manual verification for every line item, wiping out the efficiency gains.

I shifted the core architectural rule: every finding must be provably grounded in a real DOM element.

06
The principle

Grounding findings on live DOM elements.

To eliminate phantom issues, I enforced a strict rule:

If a finding cannot be mapped to a real DOM node, the engine rejects it.

This required giving the engine live session management, computed style inspection, and coordinate snapping. Instead of guessing from screenshots, the tool collects deterministic evidence directly from the browser runtime.

07
The product

The automated audit pipeline.

Today the audit pipeline runs as an automated end-to-end verification suite across staging applications:

  • Handles authentication through saved session tokens, scripted login sequences, and automated fallbacks.
  • Captures full-page screenshots alongside the DOM tree and runs live axe-core accessibility checks.
  • Explores interactive states by triggering buttons, dropdowns, dialogs, and tabs across the interface.
  • Runs deterministic rule checks (contrast math, token conformance, axe audit) alongside targeted UX heuristic lenses.
  • Deduplicates findings, filters ungrounded items, and separates copy issues into a dedicated content review track.
  • Generates direct CSS patch tokens for style defects with before/after visual diffs.
State explorer screenshot: crawling beyond the default screen to audit dialogs, drawers, and active dropdowns
State explorer: crawling beyond the default screen to audit dialogs, drawers, and active dropdowns.
Anatomy

Structured finding cards for engineering handoff.

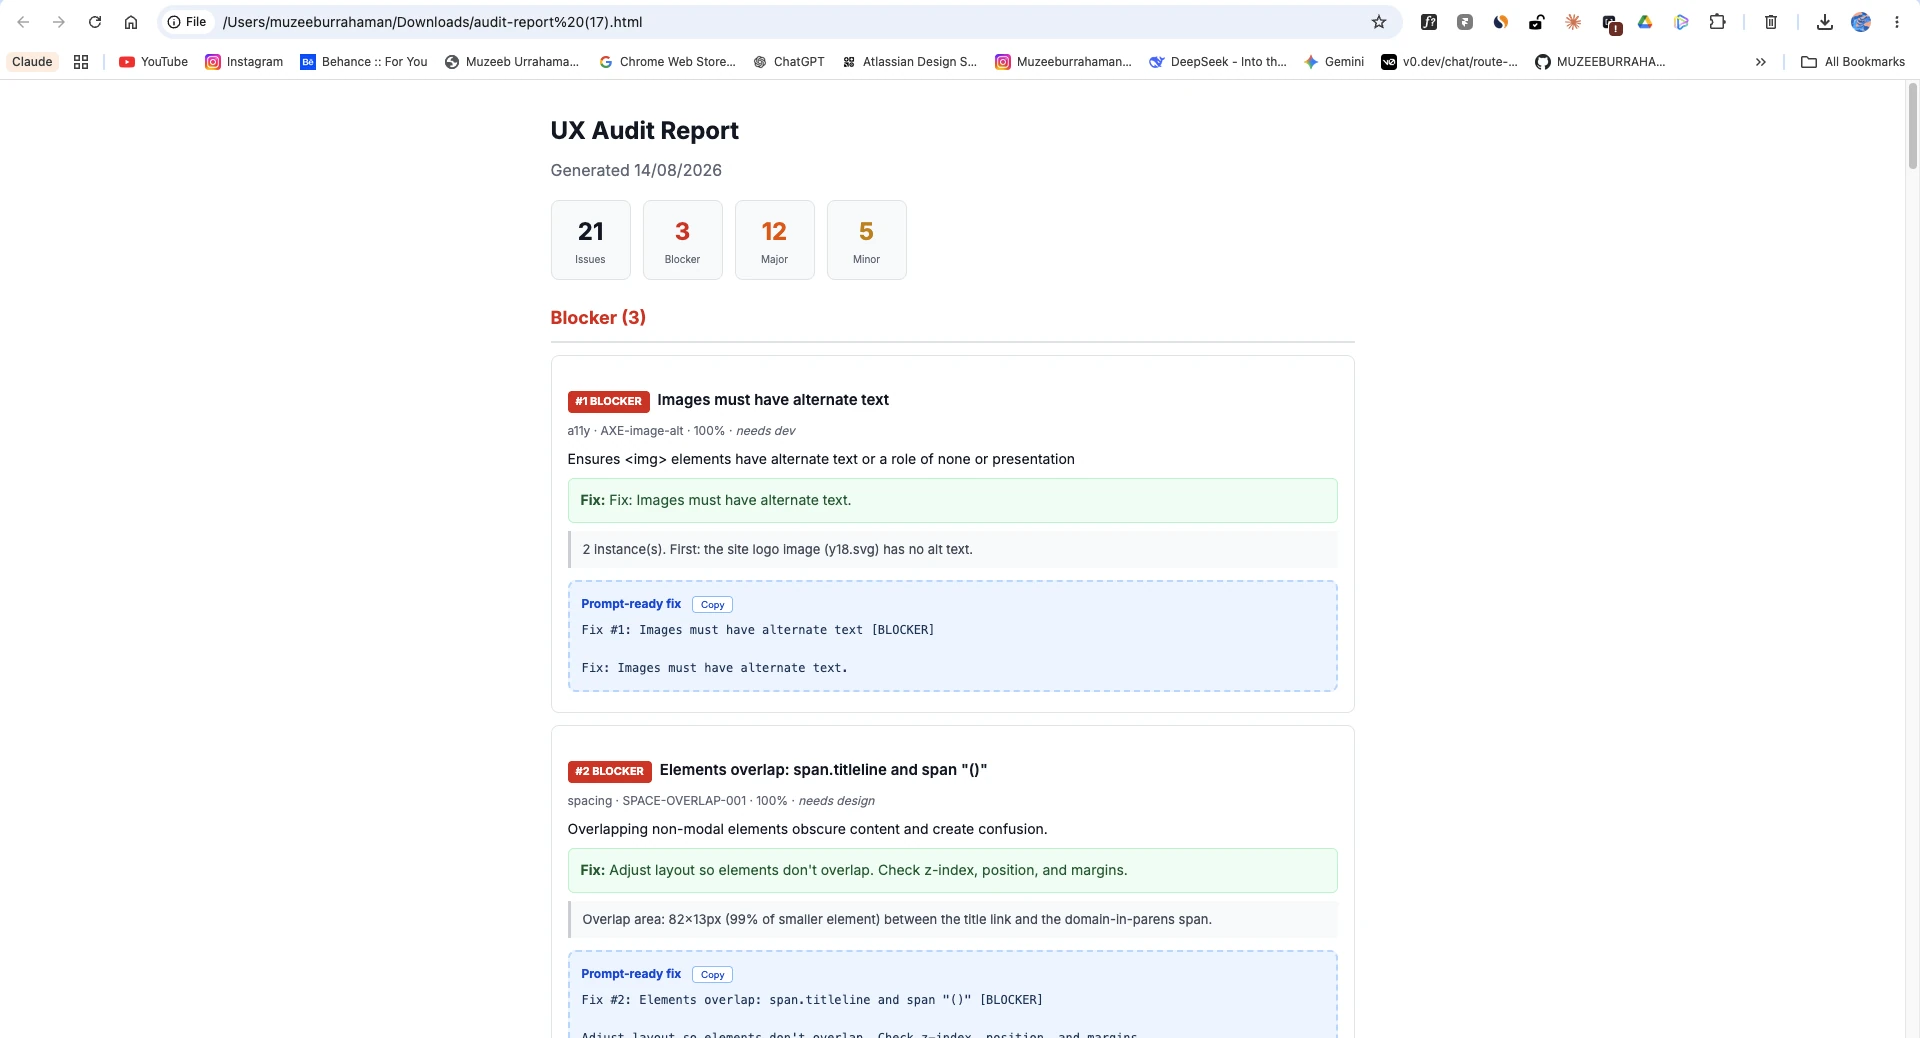
Each finding card includes a severity badge, the category and rule ID for provenance, a plain-English title, a principle reference, a copy-paste CSS fix, and a confidence score. Findings missing required evidence are filtered prior to report generation.

Anatomy of a finding card: verified DET-CONTRAST-001 finding with rule IDs, selector paths, and token fixes
Anatomy of a finding card: a verified DET-CONTRAST-001 finding with rule IDs, selector paths, and token fixes.
08
The stack

Two codebases.

The engine (ux-audit-mcp) handles capture and analysis. The service (ux-audit-service) provides a multi-product dashboard and CI automation.

LayerTechnology
runtimeNode + TypeScript, Model Context Protocol (MCP) SDK
capturePlaywright (session management, full-page screenshots, DOM inventory, state crawler)
a11y@axe-core/playwright (live axe engine execution per page)
ai-visionOpenAI-compatible SDK with Gemini Flash and OpenRouter fallbacks
imageSharp (annotation rendering), tesseract.js (OCR coordinate snapping), pixelmatch (diffing)
serviceNext.js 16, React 19, Tailwind 4, Prisma 7 + Postgres, BullMQ + Redis, GitHub Actions, Docker
09
User scenarios

One audit run. Six distinct stakeholder views.

Findings are routed into targeted views tailored for each team member:

  • Product Designer: high-level severity breakdown and design token mismatches; rejecting false positives creates persistent exclusion rules.
  • Frontend Developer: blocker views with DOM selector paths, computed style properties, and verified CSS patches.
  • QA Engineer: interactive state logs that expose dialog, drawer, and dropdown regressions missed by static tests.
  • Content Designer: dedicated copy track highlighting confusing labels alongside standardized UX copy suggestions.
  • Engineering Manager: aggregate fleet dashboard and CI release gates that block pull requests with new critical defects.
  • Leadership: quantitative compliance records showing regression resolution over time across all products.

In practice, a single run on CaseNotes produced 89 findings categorized across 35 deterministic accessibility rules, 45 heuristic design checks, and 22 copy suggestions, allowing each contributor to filter directly to their own tasks.

10
Verification Architecture

Eliminating false positives through deterministic checks.

Generating high finding counts is trivial. Generating reliable findings requires multi-tiered verification before any defect reaches a report.

  • DOM Grounding: every finding maps directly to a verified DOM node. Unanchored visual observations are automatically dropped.
  • Layered Verification: 229 hardcoded rules execute code-level checks at zero compute cost; LLM vision functions purely as a secondary check for contextual layout issues.
  • Explicit Provenance: all heuristic findings cite specific WCAG criteria or design guidelines alongside computed confidence ratings.
  • Exclusion Rules: designer rejections are permanently recorded as exclusion rules in the repository configuration.
  • Deterministic Patching: style remediation provides before/after visual diffs; layout recommendations are marked clearly for human review rather than faked as solved.
11
Results

Measured impact on staging applications.

On our CaseNotes staging app, a 4-screen audit identified 89 issues across 22 interactive states in ~11 minutes for ~$1.20 in compute and API costs. The run inspected 1,035 elements, auto-remediated 26 token mismatches, and filtered out 800+ redundant duplicate triggers. On AutoDoc, the engine identified 87 categorized findings across blocker, major, minor, and nit categories.

The engine also handles edge conditions gracefully: generating empty passing reports for compliant pages and falling back to saved session cookies when authentication challenges occur.

CaseNotes: 89 findings by track
4-screen audit, 1,035 elements, ~11 min runtime
Deterministic 35
AI 45
Content 22
AutoDoc: 87 findings by severity
Ordered by triage priority
Blocker 4 Major 26 Minor 42 Nit 12 Praise 3
$0.30

per screen, in ~3 min

Measured compute and API cost. Manual designer reviews averaged 2 to 3 hours per product.

100%

interactive state coverage

Crawls all active buttons, modals, dropdowns, and form validation states.

90%+

DOM-anchored findings

Every defect card links directly to an existing DOM selector path.

Scope note These numbers are from my own staging test runs on Omnis apps (not a peer-reviewed benchmark, not third-party audited, and not measured against production traffic).
Export

Self-contained report formats.

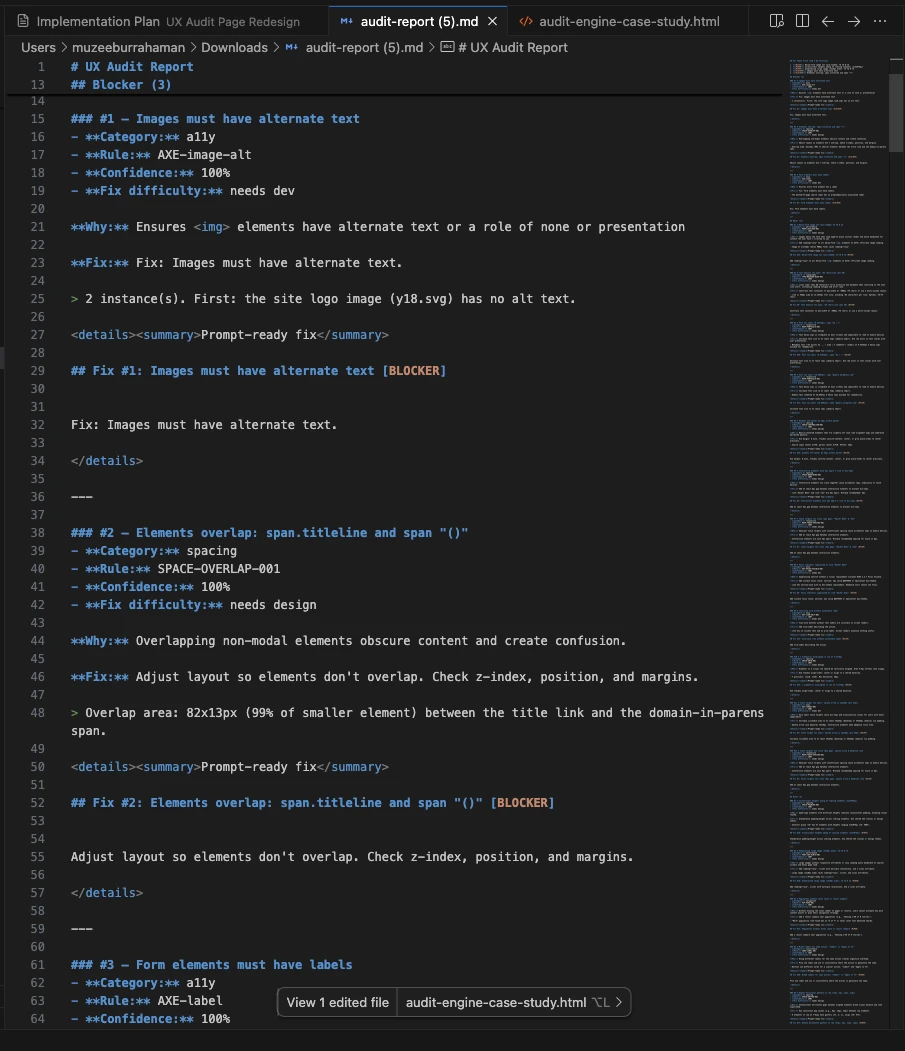
The pipeline outputs complete audits as standalone HTML dashboards and Markdown files formatted for GitHub pull requests and Linear tickets.

12
Agent Skill & Bundle

Download the UX Audit Assistant Skill.

I packaged the heuristics engine, WCAG 2.2 accessibility rules, DOM state exploration prompts, and report markdown templates into a drop-in Claude and AI agent skill bundle. Download the package to run automated design reviews in your own workflow.

Agent Skill Bundle · v1.2

UX Audit Assistant Agent Skill

Drop-in skill for Claude Code, Cursor, and custom agent loops. Automates design QA and generates grounded finding cards from real DOM states.

229+ Deterministic UX & a11y heuristics
DOM state explorer prompts & rules
Self-contained HTML + Markdown report templates
Developer-ready copy-paste fix generator
Get the skill package
ai-ux-audit.skill SKILL.md README.md

Direct download. Compatible with Claude Code, Cursor, Windsurf, and custom agent workflows.

13
Learnings

Core takeaways from building automated audit tools.

Automated design QA requires balancing speed with strict verification:

  • Grounding is non-negotiable: A tool that reports 50 issues with 15 hallucinations wastes more time in triage than a manual audit. Anchor every finding directly to a selector.
  • Coverage requires state interaction: Testing initial views misses dropdown overflow, validation errors, and empty states. Real QA requires interacting with controls.
  • Output must be diff-ready: Vague heuristic critiques get deprioritized. Providing computed CSS properties, DOM selectors, and token patches leads to immediate pull request merges.
Project Status

Production readiness and scope boundary.

The system is a fully functional engineering prototype with 187 automated tests and ~27,000 lines of TypeScript. Following company restructuring and staging environment changes, further enterprise-scale validation remains open.

Next engineering steps include multi-tenant baseline tracking, automated regression alerting, and direct Figma annotation synchronization.

Takeaway Clear technical boundaries and evidence criteria define durable design engineering.
14
Future Roadmap

If I picked this back up.

The project is currently parked, not active (see §13). This isn't a committed roadmap, it's what I'd build next if I resumed it.

  • Phase 1: Baseline Tracking: automated initial crawl establish product baselines to flag regressions on future runs.
  • Phase 2: CI Integration: GitHub Actions integration that runs audits on staging deploys and flags new blockers directly on pull requests.
  • Phase 3: Remediation Verification: automated re-crawling following PR merges to confirm target defects have been resolved.
  • Phase 4: Figma Canvas Sync: pushing verified staging annotations directly onto design system canvas files via Figma REST APIs.
15
Technical Q&A

Common technical and design inquiries.

Who approved giving a product designer live credentials to staging environments?
No new grant was needed: it reused the same staging access I already held as the product designer manually auditing those apps screen by screen. The engine logs in with my credentials, scoped to the same environments I was already reviewing; it never touched production or anyone else's access.
Are you a designer or an engineer?
Product design is my core foundation: research, UX architecture, interaction design, and design systems. I also write production TypeScript to ship working prototypes and developer tooling end-to-end.
What was your contribution compared to engineering?
I conceived, designed, and built the entire engine independently, covering the MCP architecture, Playwright crawlers, axe integrations, and Next.js reporting dashboard.
How do you prevent model hallucinations?
Deterministic checks evaluate objective rules (contrast math, aria attributes) directly. AI heuristic findings are rejected unless they map to a valid DOM node and pass structured false-positive validation.
How does this differ from axe-core or Lighthouse?
Lighthouse and axe evaluate a single static URL. This engine authenticates, crawls interactive application states, pairs axe-core with semantic layout heuristics, and exports diff-ready CSS token patches.
How did you measure audit effectiveness?
By tracking verified findings per screen and measuring false-positive rates against real product staging environments.
Can this deploy to production CI pipelines?
Yes. The containerized MCP service connects directly to GitHub Actions for automated regression gating on release candidates.